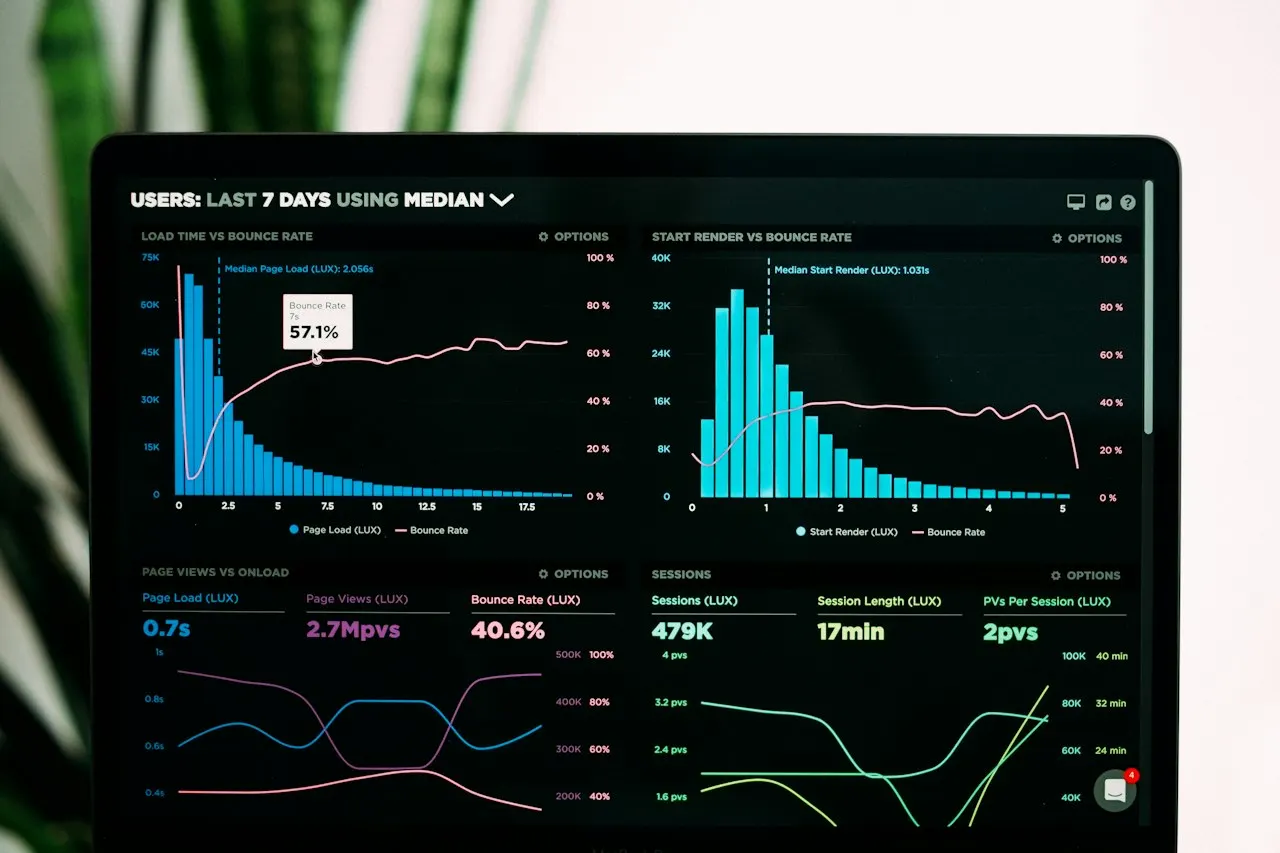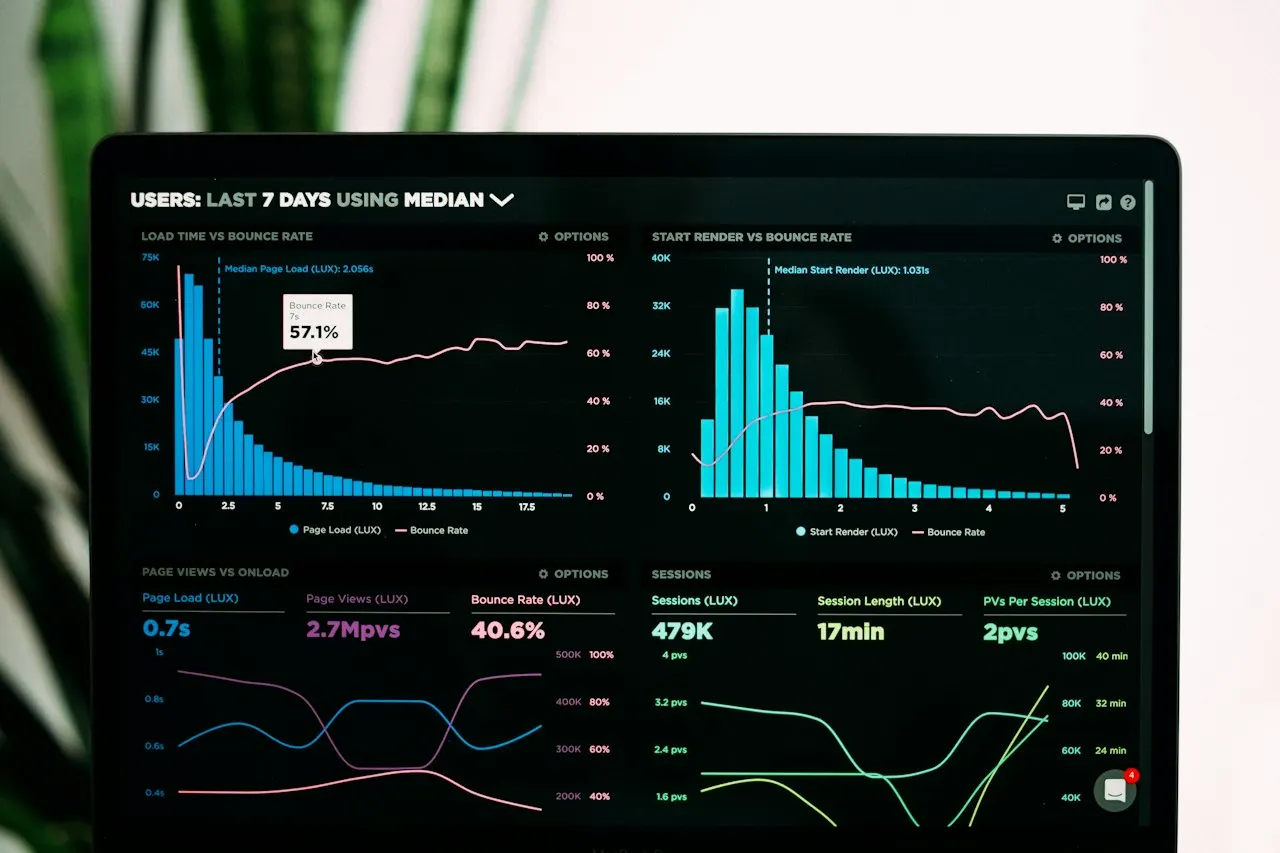
Ask a plain-language question and get a dashboard that updates on its own: that is the promise of Claude Dashboards, the new feature Anthropic launched on October 8, 2026. For an SME juggling a spreadsheet, a CRM, and a data warehouse, this AI dashboard changes how a business checks its own numbers, with no query writing required. Here is what the feature actually does, its limits, and what it signals for day-to-day business reporting.
At a glance
- Anthropic launched Claude Dashboards and Claude Motion in beta on October 8, 2026, built directly into Claude.
- Claude Dashboards turns a plain-language question into a dashboard connected to Redshift, BigQuery, ClickHouse, Databricks, or Snowflake, or Salesforce, and keeps it current automatically.
- Every figure shown is clickable: Claude displays, and can explain, the query behind it.
- Claude Docs, Slides, and Design exited beta the same day and are now available on every plan, including Free.
- For an SME, the immediate value is fast data exploration, not (yet) a replacement for an established Business Intelligence tool.
What is Claude Dashboards?
Claude Dashboards is a beta Claude feature that builds a dashboard from a question asked in plain language. An owner or employee might type: "how has revenue by region trended this quarter?" Claude then queries the connected data and builds charts that refresh as the underlying numbers change.
The feature connects to data warehouses and tools already in place at a company: Amazon Redshift, BigQuery, ClickHouse, Databricks, and Snowflake, plus CRM tools such as Salesforce. Other connectors already configured in the organization also work. According to Anthropic, Claude Dashboards is available in beta on paid plans; several specialized outlets (TestingCatalog, Unite.AI) report that this concretely means the Pro, Max, Team, and Enterprise tiers.
Ask the question
Claude queries the data
The dashboard appears
Check the source
Anthropic positions this use case for quick, exploratory questions rather than deep, tooled analysis. Support for more established BI tools, such as Looker or Tableau, is only listed as "coming soon."
Claude Motion and the other October 8 updates
The same day, Anthropic launched Claude Motion, a feature that turns a prompt into a short animated explainer, exportable as an MP4. It is invoked by typing "/motion" in the conversation and stays limited, in beta, to Team and Enterprise plans. Worth noting for trust: Motion does not rely on a video generation model. Claude writes code that animates text, charts, shapes, and images, so there is no generated footage and no synthetic people.
Anthropic also took Claude Docs, Slides, and Design out of beta: these tools are now available on every plan, including the free tier. The company states that more than 45 million documents, decks, and designs have already been created in Claude. The standalone Claude Design site (claude.ai/design) keeps working until December 14, 2026, after which only the features built into Claude will remain.
Traditional Business Intelligence
Often needs an analyst or consultant to configure dashboards. Updates and queries stay fixed until an expert changes them. A learning curve for an owner who just wants a one-off answer.
Claude Dashboards
A dashboard starts from a plain-language question. Charts refresh automatically. Every figure stays checkable in one click, with no dependency on an available expert.
Access by Claude plan
| Feature | Pro / Max | Team | Enterprise |
|---|---|---|---|
| Claude Dashboards (beta) | Yes, on paid plans | Yes | Yes, off by default |
| Claude Motion (beta) | No | Yes | Yes, off by default |
| Docs / Slides / Design | Yes (and free) | Yes | Yes |
For Enterprise organizations, Claude Dashboards and Claude Motion are off by default: an admin must enable them under "Organization settings > Artifacts." Anthropic has not published an additional price: the feature is included in the existing subscription, counted like the rest of Claude usage.
Check before enabling
Claude Dashboards only accesses the tables, objects, and connectors an admin explicitly authorized. Before opening this access to a whole team, check the exact scope of granted permissions, and test first on non-sensitive data while the feature stays in beta.
What this means for an SME
For an SME owner, the concrete benefit is shrinking the gap between a question and a numeric answer. Until now, getting an up-to-date chart on sales by region often meant asking a colleague who could write a query, or waiting for an existing dashboard to be adapted. With Claude Dashboards, the question goes in directly, and checking the source (the displayed query) limits the "black box" risk.
Still, this remains a fast exploration tool, not a substitute for an existing reporting infrastructure. A business that depends on regulated reports, strict business definitions, or formal data governance will still benefit from having its critical dashboards validated by an established BI tool, at least during the beta phase.
Key takeaway
Claude Dashboards complements a Business Intelligence tool, it does not replace it. For a one-off question or exploration, the time saved is real; for an official reporting metric, keep a human check in place.
FAQ
Does Claude Dashboards replace a Business Intelligence tool?
No, not as it stands. Anthropic positions the feature for quick, exploratory questions. Support for established tools like Looker or Tableau is listed as "coming soon," and the company recommends keeping a BI tool for deep analysis.
What data can Claude Dashboards use?
Only the warehouses and CRMs connected and authorized by an admin: Amazon Redshift, BigQuery, ClickHouse, Databricks, Snowflake, Salesforce, plus any other connectors already configured in the organization.
How much does Claude Dashboards cost?
Anthropic has not published an additional price. The feature is included in existing paid plans and draws on the usage already covered by the subscription, with no separate billing announced so far.
Is my data safe with Claude Dashboards?
The feature always shows the query behind each figure, which makes it easier to verify. For Enterprise accounts, it is off by default and must be turned on deliberately by an admin. As with any beta tool connected to company data, it remains prudent to start with non-sensitive datasets.
Claude Dashboards reflects a broader trend: generative AI is now moving into the day-to-day reporting of SMEs, not just writing or coding. To go deeper on structuring AI adoption in your business, check out our other resources on the LUWAI Mag or read real SME success stories.